The Great London:
Climate Change
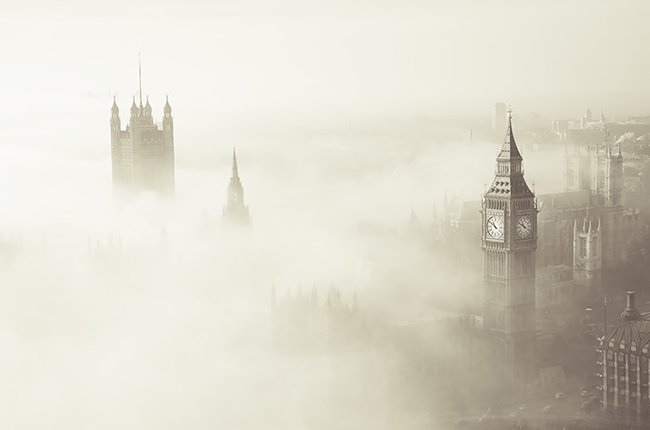
Natural Heritage: Researchers solve mystery of historic 1952 London fog and current Chinese haze
Earth Science: New evidence found of land and ocean responses to climate change over last millennium

Natural Heritage: More infectious diseases emerging because of climate change

Environment: Warming opens famed Northwest Passage to navigation

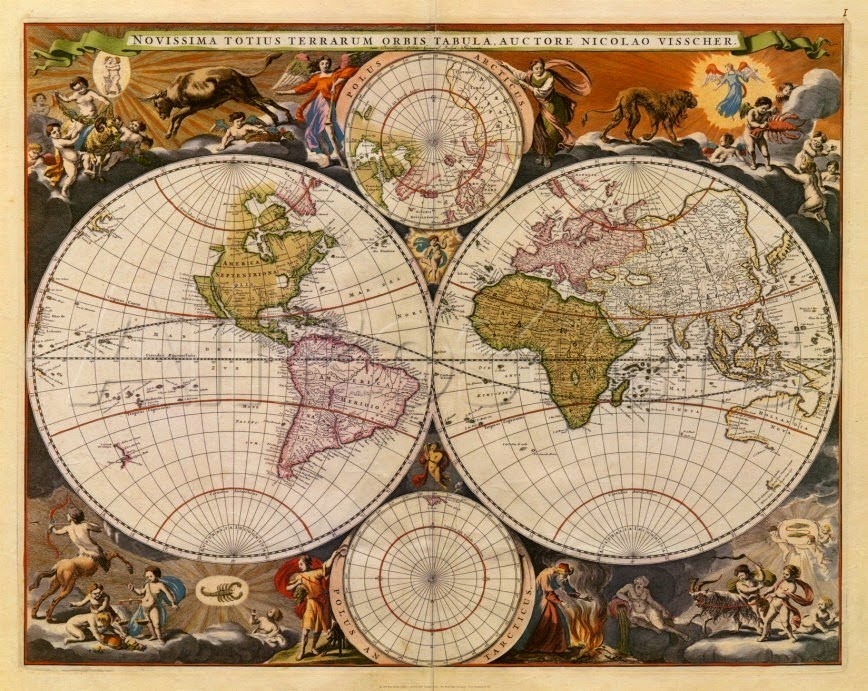
Natural Heritage: Epoch-defining study pinpoints when humans came to dominate planet Earth
Natural Heritage: Coastal erosion study could hold valuable lessons for climate change mitigation

Environment: Scientists predict extensive ice loss from huge Antarctic glacier

Environment: Arctic sea ice hits record low

Environment: Kew report urges global scientific community to secure health of the planet

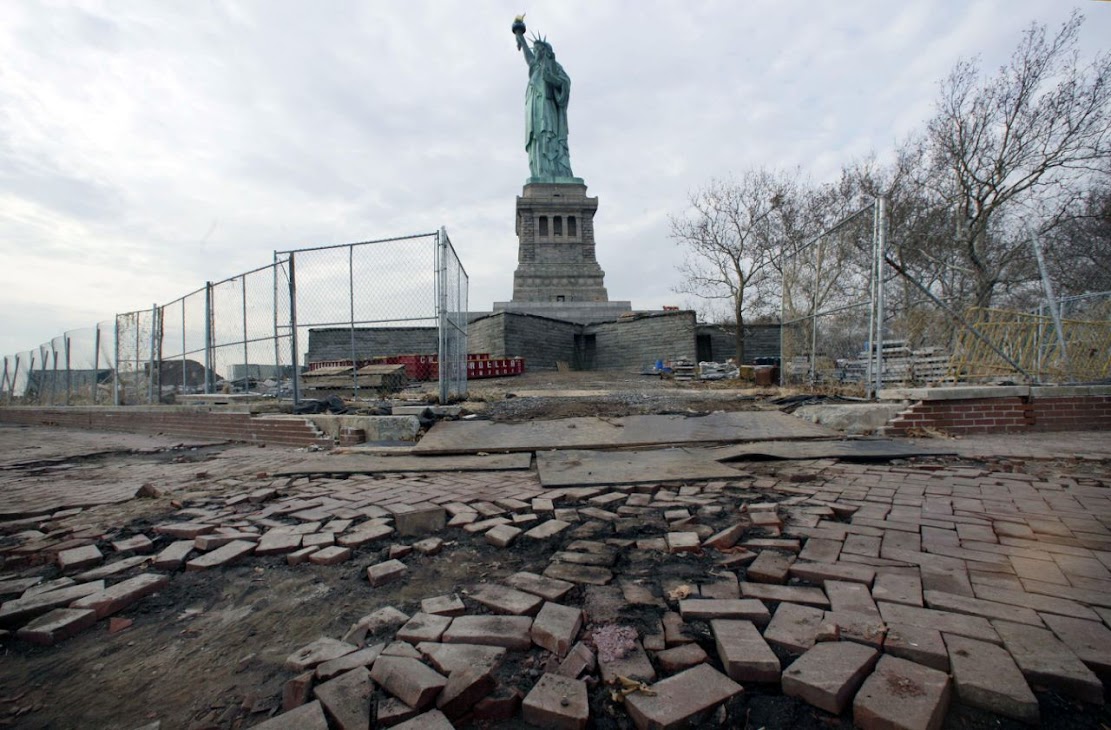
Natural Heritage: Drowning history: Sea level rise threatens US historic sites
Palaeontology: Ice core evidence suggests famine worsened Black Death

Greenland: Greenland on thin ice?

Environment: Quantifying the individual contribution to Arctic sea-ice melt

Northern Europe: The coldest decade of the millennium?

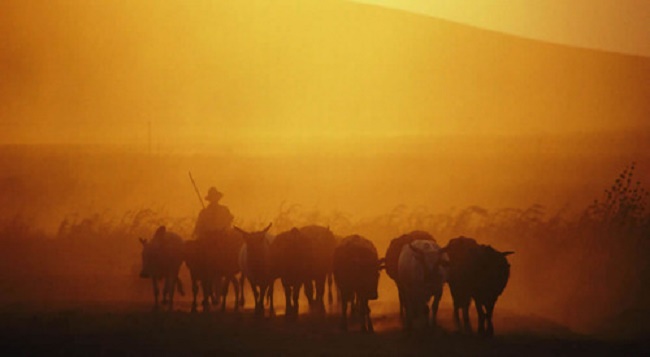
Fossils: Mega palaeolake in southern Sahara reduced to desert in just a few hundred years

Ecosystems: Humans artificially drive evolution of new species

Environment: Wetlands and agriculture, not fossil fuels could be causing a global rise in methane
UK: More than one in ten UK species threatened with extinction

Ecosystems: Immense species richness of bacterial-eating microorganisms discovered in soil

Environment: Fossil fuel emissions will complicate C14 dating, warns scientist
