Scientists studying the Chicxulub crater have shown how large asteroid impacts deform rocks in a way that may produce habitats for early life.
Recovered core from the Chicxulub impact crater [Credit: AWuelbers@ECORD_IODP]
Around 65 million years ago a massive asteroid crashed into the Gulf of Mexico causing an impact so huge that the blast and subsequent knock-on effects wiped out around 75 per cent of all life on Earth, including most of the dinosaurs. This is known as the Chicxulub impact.
In April and May 2016, an international team of scientists undertook an offshore expedition and drilled into part of the Chicxulub impact crater. Their mission was to retrieve samples from the rocky inner ridges of the crater -- known as the 'peak ring' -- drilling 506 to 1335 metres below the modern day sea floor to understand more about the ancient cataclysmic event.
Now, the researchers have carried out the first analysis of the core samples. They found that the impact millions of years ago deformed the peak ring rocks in such a way that it made them more porous, and less dense, than any models had previously predicted.
Recovered core from the Chicxulub impact crater [Credit: AWuelbers@ECORD_IODP]
Porous rocks provide niches for simple organisms to take hold, and there would also be nutrients available in the pores, from circulating water that would have been heated inside the Earth's crust. Early Earth was constantly bombarded by asteroids, and the team have inferred that this bombardment must have also created other rocks with similar physical properties. This may partly explain how life took hold on Earth.
The study, which is published today in the >journal Science, also confirmed a model for how peak rings were formed in the Chicxulub crater, and how peak rings may be formed in craters on other planetary bodies.
The team's new work has confirmed that the asteroid, which created the Chicxulub crater, hit the Earth's surface with such a force that it pushed rocks, which at that time were ten kilometres beneath the surface, farther downwards and then outwards. These rocks then moved inwards again towards the impact zone and then up to the surface, before collapsing downwards and outwards again to form the peak ring. In total they moved an approximate total distance of 30 kilometres in a matter of a few minutes.
Recovered core from the Chicxulub impact crater [Credit: DSmith@ECORD]
Professor Joanna Morgan, lead author of the study from the Department of Earth Science and Engineering, said: "It is hard to believe that the same forces that destroyed the dinosaurs may have also played a part, much earlier on in Earth's history, in providing the first refuges for early life on the planet. We are hoping that further analyses of the core samples will provide more insights into how life can exist in these subterranean environments."
The next steps will see the team acquiring a suite of detailed measurements from the recovered core samples to refine their numerical simulations. Ultimately, the team are looking for evidence of modern and ancient life in the peak-ring rocks. They also want to learn more about the first sediments that were deposited on top of the peak ring, which could tell the researchers if they were deposited by a giant tsunami, and provide them with insights into how life recovered, and when life actually returned to this sterilised zone after the impact.
Source: Imperial College London [November 17, 2016]
A multidisciplinary research team including University of Granada (UGR) researchers has analyzed two sea bed loggings retrieved from the Alboran Sea's basin at very high resolution and reconstructed climate and oceanographic conditions over the last millennium, including the anthropogenic influence in the westernmost region of the Mediterranean Sea.
Two sea bed loggings from the Alboran Sea have been analyzed at very high resolution and have allowed to reconstruct climate and oceanographic conditions as well as anthropogenic influence in the westernmost region of the Mediterranean Sea over that period [Credit: UGRdivulga]
Global warming, climate change and their effects on health and safety are probably the worst threats in mankind's history. Recent reports from the Intergovernmental Panel on Climate Change (IPCC 2007, 2014) have accumulated scientific evidence that the observed rise in mean ground temperature all over the world from the beginning of the 20th century is probably due to anthropogenic influence.
Moreover, global mean concentration of carbon dioxide in the atmosphere has risen since the industrial revolution due to human activities. This concentration has surpassed that found in ice cores over the last 800 000 years. In January 2016, NASA and the U.S. National Oceanic and Atmospheric Administration (NOAA) revealed that global mean temperature in 2015 was the highest since 1880, when records began.
Reconstructions of the global ground temperature in the Northern Hemisphere over the last millennium show hotter conditions during the so called Medieval Climatic Anomaly (800-1300 A.C.) and cooler temperatures during the Little Ice Age (1300-1850 A.C.).
Natural climate variability
Climate models give us a coherent explanation of the progressive cooling over the last millennium due to a natural climate variability (solar cycle changes and volcanic eruptions). However, we can see that this global tendency has reverted during the 20th century. Climate models are not capable of simulating the fast warming observed during the last century without including human impact along with natural mechanisms of climate forcing.
With this in mind, a multidisciplinary team of researchers has conducted a study reconstructing climate and oceanographic conditions in the westernmost region of the Mediterranean Sea. For that purpose, they have used marine sediments retrieved from the Alboran Sea's basin.
As a semi-closed basin located in a latitude affected by several climate types, it's especially sensitive and vulnerable to anthropogenic and climate forcing. Several organic and inorganic geochemical indicators have been integrated in the model for this research, thus deducing climate variables such as sea surface temperature, humidity, changes in vegetation cover, changes in sea currents, and human impact.
These indicators have shown consistent climate signals in the two sea bed loggings—essentially hot and dry climate conditions during the Medieval Climatic Anomaly, which switched to mostly cold and wet conditions during the Little Ice Age. The industrial period showed wetter conditions than during the Little Ice Age, and the second half of the 20th century has been characterized by an increasing aridity.
Climate variability in the Mediterranean region seems to be driven by variations in solar irradiation and changes in the North Atlantic Oscillation (NAO) during the last millennium. The NAO alternates a positive phase with a negative one. The positive phase is characterized by western winds, which are more intense and move storms towards northern Europe, which resulted in dry winters in the Mediterranean region and the north of Africa during the Medieval Climatic Anomaly and the second half of the 20th century.
In contrast, the negative phase is associated with opposite conditions during the Little Ice Age and the industrial period. Our records show that during NAO prolonged negative phases (1450 and 1950 A.C.), there occurred a weakening of the thermohaline circulation and a reduction of "upwelling" events (emergence of colder, more nutrient-rich waters). Anthropogenic influence shows up in the unprecedented increase of temperature, progressive aridification and soil erosion, and an increase of polluting elements since the industrial period. On a broad scale, atmospheric circulation patterns, oceanic circulation patterns (the NAO and the Atlantic meridional overturning circulation), and variations in solar irradiance seem to have played a key role during the last millennium.
Results show that recent climate records in the westernmost region of the Mediterranean Sea are caused by natural forcing and anthropogenic influence. The main conclusions derived from this research have been published in a special volume of the >Journal of the Geological Society of London about climate change during the Holocene.
Molecular-based moisture indicators, remains of midges and climate simulations have provided climate scientists with the final piece to one of the most enduring puzzles of the last Ice Age.
The site in Sweden where scientists located fossilised midges from a prehistoric lake [Credit: Barbara Wohlfarth/University of Stockholm]
For years, researchers have struggled to reconcile climate models of the Earth, 13,000 years ago, with the prevailing theory that a catastrophic freshwater flood from the melting North American ice sheets plunged the planet into a sudden and final cold snap, just before entering the present warm interglacial.
Now, an international team of scientists, led by Swedish researchers from Stockholm University and in partnership with UK researchers from the Natural History Museum (NHM) London, and Plymouth University, has found evidence in the sediments of an ancient Swedish lake that it was the melting of the Scandinavian ice sheet that provides the missing link to what occurred at the end of the last Ice Age. The study, published in Nature Communications, today, examined moisture and temperature records for the region and compared these with climate model simulations.
Francesco Muschitiello, a PhD researcher at Stockholm University and lead author of the study, said: "Moisture-sensitive molecules extracted from the lake's sediments show that climate conditions in Northern Europe became much drier around 13,000 years ago."
Steve Brooks, Researcher at the NHM, added: "The remains of midges, contained in the lake sediments, reveal a great deal about the past climate. The assemblage of species, when compared with modern records, enable us to track how, after an initial warming of up to 4° Centigrade at the end of the last Ice Age, summer temperatures plummeted by 5°C over the next 400 years."
Dr Nicola Whitehouse, Associate Professor in Physical Geography at Plymouth University, explained: "The onset of much drier, cooler summer temperatures, was probably a consequence of drier air masses driven by more persistent summer sea-ice in the Nordic Seas."
According to Francesco Muschitiello the observed colder and drier climate conditions were likely driven by increasingly stronger melting of the Scandinavian ice sheet in response to warming at the end of the last Ice Age; this led to an expansion of summer sea ice and to changes in sea-ice distribution in the eastern region of the North Atlantic, causing abrupt climate change. Francesco Muschitiello added: "The melting of the Scandinavian ice sheet is the missing link to understanding current inconsistencies between climate models and reconstructions, and our understanding of the response of the North Atlantic system to climate change."
Dr Francesco Pausata, postdoctoral researcher at Stockholm University, explained: "When forcing climate models with freshwater from the Scandinavian Ice Sheet, the associated climate shifts are consistent with our climate reconstructions."
The project leader, Professor Barbara Wohlfarth from Stockholm University, concluded: "The Scandinavian ice sheet definitely played a much more significant role in the onset of this final cold period than previously thought. Our teamwork highlights the importance of paleoclimate studies, not least in respect to the ongoing global warming debate."
Source: University of Plymouth [November 17, 2015]
Using the oldest fossil micrometeorites -- space dust -- ever found, Monash University-led research has made a surprising discovery about the chemistry of Earth's atmosphere 2.7 billion years ago.
One of 60 micrometeorites extracted from 2.7 billion year old limestone, from the Pilbara region in Western Australia. These micrometeorites consist of iron oxide minerals that formed when dust particles of meteoritic iron metal were oxidised as they entered Earth's atmosphere, indicating that the ancient upper atmosphere was surprisingly oxygen-rich [Credit: Andrew Tomkins]
The findings of a new study >published in the journal Nature -- led by Dr Andrew Tomkins and a team from the School of Earth, Atmosphere and Environment at Monash, along with scientists from the Australian Synchrotron and Imperial College, London -- challenge the accepted view that Earth's ancient atmosphere was oxygen-poor. The findings indicate instead that the ancient Earth's upper atmosphere contained about the same amount of oxygen as today, and that a methane haze layer separated this oxygen-rich upper layer from the oxygen-starved lower atmosphere.
Dr Tomkins explained how the team extracted micrometeorites from samples of ancient limestone collected in the Pilbara region in Western Australia and examined them at the Monash Centre for Electron Microscopy (MCEM) and the Australian Synchrotron.
"Using cutting-edge microscopes we found that most of the micrometeorites had once been particles of metallic iron -- common in meteorites -- that had been turned into iron oxide minerals in the upper atmosphere, indicating higher concentrations of oxygen than expected," Dr Tomkins said.
"This was an exciting result because it is the first time anyone has found a way to sample the chemistry of the ancient Earth's upper atmosphere," Dr Tomkins said.
Imperial College researcher Dr Matthew Genge -- an expert in modern cosmic dust -- performed calculations that showed oxygen concentrations in the upper atmosphere would need to be close to modern day levels to explain the observations.
"This was a surprise because it has been firmly established that the Earth's lower atmosphere was very poor in oxygen 2.7 billion years ago; how the upper atmosphere could contain so much oxygen before the appearance of photosynthetic organisms was a real puzzle," Dr Genge said.
Dr Tomkins explained that the new results suggest the Earth at this time may have had a layered atmosphere with little vertical mixing, and higher levels of oxygen in the upper atmosphere produced by the breakdown of CO 2 by ultraviolet light.
"A possible explanation for this layered atmosphere might have involved a methane haze layer at middle levels of the atmosphere. The methane in such a layer would absorb UV light, releasing heat and creating a warm zone in the atmosphere that would inhibit vertical mixing," Dr Tomkins said.
"It is incredible to think that by studying fossilised particles of space dust the width of a human hair, we can gain new insights into the chemical makeup of Earth's upper atmosphere, billions of years ago." Dr Tomkins said.
Dr Tomkins outlined next steps in the research.
"The next stage of our research will be to extract micrometeorites from a series of rocks covering over a billion years of Earth's history in order to learn more about changes in atmospheric chemistry and structure across geological time. We will focus particularly on the great oxidation event, which happened 2.4 billion years ago when there was a sudden jump in oxygen concentration in the lower atmosphere."
A study, carried out by Professor Andrew C. Scott of the Department of Earth Sciences at Royal Holloway, University of London and Professor Sue Rimmer from Southern Illinois University, reveals widespread fire occurred on Earth more than 80 million years after plants first invaded the land.
Scanning Electron Micrographs of Fossil Charcoal of a small primitive fern-like plant from from the late Devonian (355 million years ago) from North America [Credit: University of Royal Holloway London]
The findings, published in the American Journal of Science, indicate that although plants were first detected on land more than 440 million years ago there is only scant evidence of fire at that time.
Professor Scott, said: "What surprised us was that many of these early extensive fires were surface fires burning the undergrowth, as we can see the anatomy of the plants being burned through scanning electron microscope studies of larger pieces of the fossil charcoal."
He added: "This may be because plants were small and were limited in their distribution but over the following 50 million years they diversified and spread across the globe and some of the plants were trees and could have provided a good fuel to burn. Extensive forest fires soon followed, however and we see widespread charcoal deposits throughout the Lower Carboniferous (Mississippian) Period 358-323 million years ago."
Professor Scott and Professor Rimmer made the discovery after analysing charcoal which was washed in to an ocean that lay across what is now part of present day North America.
The team believes that it was not fuel availability that prevented widespread fire, or climate, but that the atmospheric oxygen levels were too low. It had been suggested that only when oxygen levels rose to above 17% (it is 21% today) that widespread fires would be found. This new data suggests that it was at around 360 million years ago, in the latest Devonian Period, that this threshold was reached and probably never went below this level for the rest of geological history.
This time period defines a new phase of the evolution of Earth System and regular wildfire would have played an important role in the evolution of both animals and plants.
Source: University of Royal Holloway London [October 21, 2015]
Geologists have for the first time seen and documented the Banda Detachment fault in eastern Indonesia and worked out how it formed.
Pulau Banta island in the Banta Sea [Credit: Jialiang Gao/WikiCommons]
Lead researcher Dr Jonathan Pownall from The Australian National University (ANU) said the find will help researchers assess dangers of future tsunamis in the area, which is part of the Ring of Fire -- an area around the Pacific Ocean basin known for earthquakes and volcanic eruptions.
"The abyss has been known for 90 years but until now no one has been able to explain how it got so deep," Dr Pownall said.
"Our research found that a 7 km-deep abyss beneath the Banda Sea off eastern Indonesia was formed by extension along what might be Earth's largest-identified exposed fault plane."
By analysing high-resolution maps of the Banda Sea floor, geologists from ANU and Royal Holloway University of London found the rocks flooring the seas are cut by hundreds of straight parallel scars.
These wounds show that a piece of crust bigger than Belgium or Tasmania must have been ripped apart by 120 km of extension along a low-angle crack, or detachment fault, to form the present-day ocean-floor depression.
Diagram showing the Banda Detachment fault beneath the Weber Deep basin [Credit: ANU]
Dr Pownall said this fault, the Banda Detachment, represents a rip in the ocean floor exposed over 60,000 square kilometres.
"The discovery will help explain how one of Earth's deepest sea areas became so deep," he said.
Professor Gordon Lister also from the ANU Research School of Earth Sciences said this was the first time the fault has been seen and documented by researchers.
"We had made a good argument for the existence of this fault we named the Banda Detachment based on the bathymetry data and on knowledge of the regional geology," said Professor Lister.
Dr Pownall said he was on a boat journey in eastern Indonesia in July when he noticed the prominent landforms consistent with surface extensions of the fault line.
"I was stunned to see the hypothesised fault plane, this time not on a computer screen, but poking above the waves," said Dr Pownall.
He said rocks immediately below the fault include those brought up from the mantle.
"This demonstrates the extreme amount of extension that must have taken place as the oceanic crust was thinned, in some places to zero," he said.
Dr Pownall also said the discovery of the Banda Detachment fault would help assesses dangers of future tsunamis and earthquakes.
"In a region of extreme tsunami risk, knowledge of major faults such as the Banda Detachment, which could make big earthquakes when they slip, is fundamental to being able to properly assess tectonic hazards," he said.
The research has been published in the journal >Geology.
Source: Australian National University [November 28, 2016]
An international research team is formalizing plans to drill nearly 5,000 feet below the seabed to take core samples from the crater of the asteroid that wiped out the dinosaurs.
Artist's impression of the Chicxulub asteroid impacting the Yucatan Peninsula as pterodactyls fly in the sky above. Painting by Donald E. Davis [Credit: NASA]
The group met last week in Merida, Mexico, a city within the nearly 125-mile-wide impact site, to explain the research plans and put out a call for scientists to join the expedition planned for spring 2016. The roughly $10 million in funding for the expedition has been approved and scheduled by the European Consortium for Ocean Research Drilling (ECORD) — part of the International Ocean Discovery Program (IODP) — and the International Continental Scientific Drilling Program (ICDP).
Dinosaurs and other reptiles ruled the planet for 135 million years. That all changed 65.5 million years ago when a 9-mile-wide asteroid slammed into the Earth, triggering a series of apocalyptic events that killed most large animals and plants, and wiped out the dinosaurs and large marine reptiles. The event set the stage for mammals — and eventually humans — to take over. Yet, we have few geologic samples of the now buried impact crater.
Sean Gulick, a researcher at The University of Texas at Austin Institute for Geophysics (UTIG), and a team of scientists from the U.K. and Mexico are working to change that. The team is planning to take the first offshore core samples from near the center of the impact crater, which is called Chicxulub after the seaside village on the Yucatán Peninsula near the crater’s center.
The team, led by Gulick and Joanna Morgan of Imperial College London, will be sampling the crater’s “peak ring” — an enigmatic ring of topographically elevated rocks that surrounds the crater’s center, rises above its floor and has been buried during the past 65.5 million years by sediments.
The Chicxulub crater has been filled in by sediments over the millions of years since impact. Using a gravity map, the crater's topological features can be visualized. The red and yellow are gravity highs, and green and blue are gravity lows. The white dots indicate a network of sinkholes called "cenotes,"which were formed as a result of the impact [Credit: NASA]
A peak ring is a feature that is present in all craters caused by large impacts on rocky planetoids. By sampling the Chicxulub peak ring and analyzing its key features, researchers hope to uncover the impact details that set in motion one of the planet’s most profound extinctions, while also shedding light on the mechanisms of large impacts on Earth and on other rocky planets.
“What are the peaks made of? And what can they tell us about the fundamental processes of impacts, which is this dominant planetary resurfacing phenomena?” said Gulick, who is also a research associate professor at the UT Jackson School of Geosciences. UTIG is a research unit of the Jackson School.
The researchers are also interested in examining traces of life that may have lived inside the peak ring’s rocks. Density readings of the rocks indicate that they probably are heavily broken and porous — features that may have served as protected microenvironments for exotic life that could have thrived in the hot, chemically enriched environment of the crater site after impact. Additionally, the earliest recovery of marine life should be recorded within the sediments that filled in the crater in the millions of years after the impact.
“The sediments that filled in the [crater] should have the record for organisms living on the sea floor and in the water that were there for the first recovery after the mass extinction event,” Gulick said. “The hope is we can watch life come back.”
The expedition will last for two months and involve penetrating nearly 5,000 feet beneath the seabed from an offshore platform. The core will be the first complete sample of the rock layers from near the crater’s center.
Once extracted, the core will be shipped to Germany and split in two. Half will be immediately analyzed by an international team of scientists from the U.S., U.K., Mexico and other nations, and half will be saved at a core repository at Texas A&M University for future research needs by the international community.
The team also includes researchers from the National Autonomous University of Mexico (UNAM) and Centro de Investigación Científica de Yucatán (CICY). Scientists interested in joining the mission must apply by May 8, 2015. For more information on the mission and the application process, see the European Consortium for Ocean Research Drilling’s call for applications.
Source: University of Texas at Austin [April 06, 2015]
It took 100 million years for oxygen levels in the oceans and atmosphere to increase to the level that allowed the explosion of animal life on Earth about 600 million years ago, according to a UCL-led study funded by the Natural Environment Research Council.
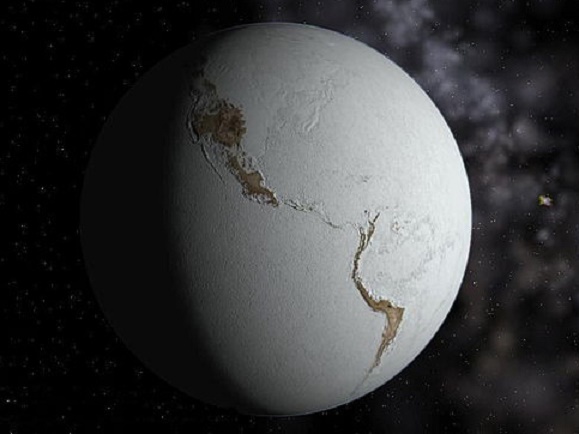
Snowball Earth [Credit: UCL]
Before now it was not known how quickly Earth's oceans and atmosphere became oxygenated and if animal life expanded before or after oxygen levels rose. The new study, published today in Nature Communications, shows the increase began significantly earlier than previously thought and occurred in fits and starts spread over a vast period. It is therefore likely that early animal evolution was kick-started by increased amounts of oxygen, rather than a change in animal behaviour leading to oxygenation.
Lead researcher, Dr Philip Pogge von Strandmann (UCL Earth Sciences), said: "We want to find out how the evolution of life links to the evolution of our climate. The question on how strongly life has actively modified Earth's climate, and why the Earth has been habitable for so long is extremely important for understanding both the climate system, and why life is on Earth in the first place."
Researchers from UCL, Birkbeck, Bristol University, University of Washington, University of Leeds, Utah State University and University of Southern Denmark tracked what was happening with oxygen levels globally 770 - 520 million years ago (Ma) using new tracers in rocks across the US, Canada and China.
Samples of rocks that were laid down under the sea at different times were taken from different locations to piece together the global picture of the oxygen levels of Earth's oceans and atmosphere. By measuring selenium isotopes in the rocks, the team revealed that it took 100 million years for the amount of oxygen in the atmosphere to climb from less than 1% to over 10% of today's current level. This was arguably the most significant oxygenation event in Earth history because it ushered in an age of animal life that continues to this day.
Dr Pogge von Strandmann, said: "We took a new approach by using selenium isotope tracers to analyse marine shales which gave us more information about the gradual changes in oxygen levels than is possible using the more conventional techniques used previously. We were surprised to see how long it took Earth to produce oxygen and our findings dispel theories that it was a quick process caused by a change in animal behaviour."
During the period studied, three big 'snowball Earth' glaciations - Sturtian (~716Ma), Marinoan (~635Ma) and Gaskiers (~580Ma) - occurred whereby the Earth's land was covered in ice and most of the oceans were frozen from the poles to the tropics. During these periods, temperatures plummeted and rose again, causing glacial melting and an influx of nutrients into the ocean, which researchers think caused oxygen levels to rise deep in the oceans.
Increased nutrients means more ocean plankton, which will bury organic carbon in seafloor sediments when they die. Burying carbon results in oxygen increasing, dramatically changing conditions on Earth. Until now, oxygenation was thought to have occurred after the relatively small Gaskiers glaciation melted. The findings from this study pushes it much earlier, to the Marinoan glaciation, after which animals began to flourish in the improved conditions, leading to the first big expansion of animal life.
Co-author Prof. David Catling (University of Washington Earth and Space Sciences), added: "Oxygen was like a slow fuse to the explosion of animal life. Around 635 Ma, enough oxygen probably existed to support tiny sponges. Then, after 580 Ma, strange creatures shaped like pizzas lived on a lightly oxygenated seafloor. Fifty million years later, vertebrate ancestors were gliding through oxygen-rich seawater. Tracking how oxygen increased is the first step towards understanding why it took so long. Ultimately, a grasp of geologic controls on oxygen levels can help us understand whether animal-like life might exist or not on Earth-like planets elsewhere."
Source: University College London [December 17, 2015]
Scientists from the Department of Earth Sciences at Royal Holloway, University of London together with colleagues from the USA, Russia and China, have discovered that forest fires across the globe were more common between 300 and 250 million years ago than they are today. This is thought to be due to higher level of oxygen in the atmosphere at that time.
Forest fires across the globe were more common between 300 and 250 million years ago than they are today, scientists have discovered. This is thought to be due to higher level of oxygen in the atmosphere at that time [Credit: NASA]
The study which was published in the journal Frontiers in Plant Science, found that peats that were to become coal contained high levels of charcoal that could only be explained by the high levels of fire activity.
The team used the data from charcoal in coal to propose that the development of fire systems through this interval was controlled predominantly by the elevated atmospheric oxygen concentration (p(O2)) that mass balance models predict prevailed. At higher levels of p(O2), increased fire activity would have rendered vegetation with high moisture contents more susceptible to ignition and would have facilitated continued combustion.
In the study they examine the environmental and ecological factors that would have impacted fire activity and conclude that of these factors p(O2) played the largest role in promoting fires in Late Paleozoic peat-forming environments and, by inference, ecosystems generally, when compared with their prevalence in the modern world.
Professor Andrew Scott, one of the lead authors, said: "High oxygen levels in the atmosphere at this time has been proposed for some time and may be why there were giant insects and arthropods at this time but our research indicates that there was a significant impact on the prevalence and scale of wildfires across the globe and this would have affected not only the ecology of the plants and animals but also their evolution."
Professor Scott and his colleagues and students at Royal Holloway have pioneered the study of fire in Earth's deep past. Professor Scott, added: "We have been able to show that wildfire was an important element in Earth System many hundreds of millions of years before the arrival of humans."
Source: University of Royal Holloway London [October 27, 2015]
The world's largest canyon may lie under the Antarctic ice sheet, according to analysis of satellite data by a team of scientists, led by Durham University.
New analysis of satellite data by a team of scientists led by Durham University shows that the world’s largest canyon system may lie under the Antarctic ice sheet [Credit: MODIS/Newcastle University]
Although the discovery needs to be confirmed by direct measurements, the previously unknown canyon system is thought to be over 1,000km long and in places as much as 1km deep, comparable in depth to the Grand Canyon in USA, but many times longer.
The canyon system is made up of a chain of winding and linear features buried under several kilometres of ice in one of the last unexplored regions of the Earth's land surface: Princess Elizabeth Land (PEL) in East Antarctica. Very few measurements of the ice thickness have been carried out in this particular area of the Antarctic, which has led to scientists dubbing it one of Antarctica's two 'Poles of Ignorance'.
The researchers believe that the landscape beneath the ice sheet has probably been carved out by water and is either so ancient that it was there before the ice sheet grew or it was created by water flowing and eroding beneath the ice.
Although not visible to the naked eye, the subglacial landscape can be identified in the surface of the ice sheet.
Faint traces of the canyons were observed using satellite imagery and small sections of the canyons were then found using radio-echo sounding data, whereby radio waves are sent through the ice to map the shape of the rock beneath it. These are very large features which appear to reach from the interior of Princess Elizabeth Land to the coast around the Vestfold Hills and the West Ice Shelf.
The canyons may be connected to a previously undiscovered subglacial lake as the ice surface above the lake shares characteristics with those of large subglacial lakes previously identified. The data suggests the area of the lake could cover up to 1250km², more than 80 times as big as Lake Windermere in the English Lake District.
An airborne survey taking targeted radio-echo sounding measurements over the whole buried landscape is now underway with the aim of unambiguously confirming the existence and size of the canyon and lake system, with results due later in 2016.
Lead researcher, Dr Stewart Jamieson, from the Department of Geography at Durham University in the UK, said: "Our analysis provides the first evidence that a huge canyon and a possible lake are present beneath the ice in Princess Elizabeth Land. It's astonishing to think that such large features could have avoided detection for so long.
"This is a region of the Earth that is bigger than the UK and yet we still know little about what lies beneath the ice. In fact, the bed of Antarctica is less well known than the surface of Mars. If we can gain better knowledge of the buried landscape we will be better equipped to understand how the ice sheet responds to changes in climate."
Co-Author Dr Neil Ross from Newcastle University in the UK, said: "Antarctic scientists have long recognised that because the way ice flows, the landscape beneath the ice sheet was subtly reflected in the topography of the ice sheet surface. Despite this, these vast deep canyons and potential large lake had been overlooked entirely.
"Our identification of this landscape has only been possible through the recent acquisition, compilation and open availability of satellite data by many different organisations (e.g. NASA, ESA and the US National Snow and Ice Data Center), to whom we are very grateful, and because of some serendipitous reconnaissance radio-echo sounding data acquired over the canyons by the ICECAP project during past Antarctic field seasons."
Co-Author Professor Martin Siegert, from the Grantham Institute at Imperial College London, UK, said: "Discovering a gigantic new chasm that dwarfs the Grand Canyon is a tantalising prospect. Geoscientists on Antarctica are carrying out experiments to confirm what we think we are seeing from the initial data, and we hope to announce our findings at a meeting of the ICECAP2 collaboration, at Imperial, later in 2016.
"Our international collaboration of US, UK, Indian, Australian and Chinese scientists are pushing back the frontiers of discovery on Antarctica like nowhere else on earth. But the stability of this understudied continent is threatened by global warming, so all the countries of the world now must rapidly reduce their greenhouse gas emissions and limit the damaging effects of climate change."
Uplift associated with the Great Rift Valley of East Africa and the environmental changes it produced have puzzled scientists for decades because the timing and starting elevation have been poorly constrained.
A 17 million-year-old whale fossil stranded far inland in Kenya now sheds light on the timing and starting elevation of East Africa's puzzling tectonic uplift, says paleontologist Louis Jacobs, Southern Methodist University, Dallas, who rediscovered the fossil [Credit: Southern Methodist University]
Now paleontologists have tapped a fossil from the most precisely dated beaked whale in the world -- and the only stranded whale ever found so far inland on the African continent -- to pinpoint for the first time a date when East Africa's mysterious elevation began.
The 17 million-year-old fossil is from the beaked Ziphiidae whale family. It was discovered 740 kilometers inland at an elevation of 620 meters in modern Kenya's harsh desert region, said vertebrate paleontologist Louis L. Jacobs, Southern Methodist University, Dallas.
At the time the whale was alive, it would have been swimming far inland up a river with a low gradient ranging from 24 to 37 meters over more than 600 to 900 kilometers, said Jacobs, a co-author of the study.
The study, published in the Proceedings of the National Academy of Sciences, provides the first constraint on the start of uplift of East African terrain from near sea level.
"The whale was stranded up river at a time when east Africa was at sea level and was covered with forest and jungle," Jacobs said. "As that part of the continent rose up, that caused the climate to become drier and drier. So over millions of years, forest gave way to grasslands. Primates evolved to adapt to grasslands and dry country. And that's when -- in human evolution -- the primates started to walk upright."
Identified as a Turkana ziphiid, the whale would have lived in the open ocean, like its modern beaked cousins. Ziphiids, still one of the ocean's top predators, are the deepest diving air-breathing mammals alive, plunging to nearly 10,000 feet to feed, primarily on squid.
A map of Africa and Kenya showing where a 17-million-year-old whale fossil was found far inland [Credit: Wichura/PNAS]
In contrast to most whale fossils, which have been discovered in marine rocks, Kenya's beached whale was found in river deposits, known as fluvial sediments, said Jacobs, a professor in the Roy M. Huffington Department of Earth Sciences of SMU's Dedman College of Humanities and Sciences. The ancient large Anza River flowed in a southeastward direction to the Indian Ocean. The whale, probably disoriented, swam into the river and could not change its course, continuing well inland.
"You don't usually find whales so far inland," Jacobs said. "Many of the known beaked whale fossils are dredged by fishermen from the bottom of the sea."
Determining ancient land elevation is very difficult, but the whale provides one near sea level.
"It's rare to get a paleo-elevation," Jacobs said, noting only one other in East Africa, determined from a lava flow.
Beaked whale fossil surfaced after going missing for more than 30 years
The beaked whale fossil was discovered in 1964 by J.G. Mead in what is now the Turkana region of northwest Kenya.
Mead, an undergraduate student at Yale University at the time, made a career at the Smithsonian Institution, from which he recently retired. Over the years, the Kenya whale fossil went missing in storage. Jacobs, who was at one time head of the Division of Paleontology for the National Museums of Kenya, spent 30 years trying to locate the fossil. His effort paid off in 2011, when he rediscovered it at Harvard University and returned it to the National Museums of Kenya.
The fossil is only a small portion of the whale, which Mead originally estimated was 7 meters long during its life. Mead unearthed the beak portion of the skull, 2.6 feet long and 1.8 feet wide, specifically the maxillae and premaxillae, the bones that form the upper jaw and palate.
The researchers reported their findings in "A 17 million-year-old whale constrains onset of uplift and climate change in East Africa" online at the PNAS web site.
Modern cases of stranded whales have been recorded in the Thames River in London, swimming up a gradient of 2 meters over 70 kilometers; the Columbia River in Washington state, a gradient of 6 meters over 161 kilometers; the Sacramento River in California, a gradient of 4 meters over 133 kilometers; and the Amazon River in Brazil, a gradient of 1 meter over 1,000 kilometers.
Source: Southern Methodist University [March 17, 2015]
A new study presents evidence that the rise of atmospheric oxygenation did indeed occur 2.4-2.1 billion years ago. It also shows that biological usage of copper became prominent after the so called 'Great Oxidation Event.' An international team of researchers has recently published the study in the Proceedings of the National Academy of Sciences.
According to a new study the rise of atmospheric oxygenation occurred 2.4-2.1 billion years ago and that biological usage of copper became prominent after the so called 'Great Oxidation Event' [Credit: Catarina Nilsson/Mostphotos]
"Our findings make it possible to reconstruct nutrient content in early marine settings and demonstrate that the iron-rich content of the early oceans must have severely restricted the availability of nutrients important for life", says Dr Ernest Chi Fru of Stockholm University, who has led the research group.
The study suggests a gradual shift in mainly negative copper isotopic composition of marine carbon-rich sediments, beginning at 2.4 billion years ago (Ga), to permanently positive values after 2.3 Ga. The authors argue that the change reflects the drawn-out nature of the Great Oxidation Event (GOE), when atmospheric oxygen content went from virtually nothing, starting at 2.4 Ga, to peak at near present day levels by 2.3 Ga.
Fundamentally, the high iron content of the early oceans are suggested to have played a critical role in determining trace metal availability, whereby copper levels increased when decreasing marine iron content fell by about 1 000 times after the GOE. The research has been made by examining carbon-rich rocks deposited at the bottom of ancient oceans 2.66-2.1 billion years ago.
"The appearance of oxygen in the atmosphere is one of the most important changes in Earth's geological history that enabled the evolution of oxygen based life. Understanding the chemistry of the very early oceans and how nutrients were made available, guide our steps towards understanding the processes that govern our own evolution", says Dr Ernest Chi Fru of Stockholm University.
The study provides a tool for tracking how oxygen levels have fluctuated through Earth's history and the evolutionary changes that accompanied these fluctuations.
"Our study is highlighting how the isotopic ratios of copper can unlock the evolution of Earth's early oceans from being oxygen-poor to more like they are today. We now hope to apply this technique to understanding other major geological events in the Earth's history", says Professor Dominik Weiss, co-author from Imperial College London.
Magnetic nanovortices in magnetite minerals are reliable witnesses of the earth's history, as revealed by the first high-resolution studies of these structures undertaken by scientists from Germany and the United Kingdom. The magnetic structures are built during the cooling of molten rock and reflect the earth's magnetic field at the time of their formation. The vortices are unexpectedly resilient to temperature fluctuations, as electron holographic experiments in Julich have verified. These results are an important step in improving our understanding of the history of the earth's magnetic field, its core and plate tectonics.
Electron microscopy image of a magnetite nanocrystal (left) and the magnetic vortex structure (right), made visible for the first time by researchers from Jülich and the United Kingdom using electron holography [Credit: Imperial College London]
The earth's magnetic field performs important functions: it protects us, for example, from charged particles from space and enables migratory birds, bees, and other animals to navigate. However, it is not stable, and constantly changes its intensity and state. Several times in the past it has even reversed its polarity -- the north and south poles have changed places.
Scientists in the area of paleomagnetism use magnetic minerals to investigate the history of the earth's magnetic field and its formation from molten metal flowing within the earth's core, the so-called geodynamo. Furthermore, the movement of continental plates can be monitored with the aid of such rocks.
In the course of millions of years, these minerals could often have been exposed to immense temperature fluctuations, due to extreme climate change or volcanic activity, for instance. How well do the magnetic structures survive such temperature fluctuations and how reliable is the information gained from them?
An international research team has now studied this question for the first time at ultra-high resolution on samples of magnetite, the mineral dominating the magnetic properties in the earth's crust.
This micromagnetic model shows the three-dimensional vortex structure of magnetite nanocrystals [Credit: University of Edinburgh]
"It is only in a small part of naturally occurring magnetite that magnetic structures known for being very stable with respect to temperature fluctuations are found," explains Dr. Trevor Almeida of Imperial College London. "Far more common are tiny magnetic vortices. Their stability could not be demonstrated until now."
Together with colleagues from Forschungszentrum Julich, the University of Edinburgh and the University of Nottingham, Almeida has studied the magnetic vortices in magnetite nanocrystals. As the structures are so tiny -- each grain is only about the size of a virus -- there is only one method with which the nanovortices can directly be observed while they are heated up and cooled down: "A special high-resolution electron microscope at the Ernst Ruska-Centre (ER-C) in Julich is capable of making magnetic fields on the nanoscale holographically visible," explains Almeida. "In this way, images of field lines are produced almost like using iron filings around a bar magnet to make its magnetic field visible, but with a resolution in the nanometre range."
The experiments in Julich showed that although the magnetic vortices alter in strength and direction when heated up, they go back to their original state as they cool down. "Therefore magnetite rocks, which carry signs of temperature fluctuations, are indeed a reliable source of information about the history of the earth," enthuses Almeida.
In the process of electron holography, the electron beam in the microscope is split in two. One part serves as a reference; the second is directed through the sample and collects information about its magnetic structure. Both electron beams together create an interference pattern containing the information in an encrypted form. Analysis of the recorded hologram is necessary to allow conclusions to be drawn about the magnetic fields in the specimen [Credit: Forschungszentrum Jülich]
"Electron holography has made it possible for us to gain a completely new insight into the magnetic behaviour of magnetite," emphasized Prof. Rafal Dunin-Borkowski, Director at the ER-C and at the Peter Grunberg Institute in Julich.
As an expert in electron holography, he works with his Julich team on further improving the resolution of this technique and in providing German and international scientists the necessary infrastructure to perform this type of study.
"Weak magnetic fields in nanocrystals don't just play a role in paleomagnetism. In information technology, for instance, electron holograms can also be of use to help to push back the physical limits of data storage and processing."
When the Black Death swept through Europe in 1347, it was one of the deadliest disease outbreaks in human history, eventually killing between a third and half of Europeans.
Burying Plague victims [Credit: USU]
Prior work by investigators has traced the cause to plague-carrying fleas borne by rats that jumped ship in trading ports. In addition, historical researchers believe that famine in northern Europe before the plague came ashore may have weakened the population there and set the stage for its devastation.
Now, new research using a unique combination of ice-core data and written historical records indicates that the cool, wet weather blamed for the northern European famine actually affected a much wider area over a much longer period. The work, which researchers say is preliminary, paints a picture of a deep, prolonged food shortage in the years leading to the Black Death.
“The evidence indicates that the famine was a broader phenomenon, geographically and chronologically,” said Alexander More, a postdoctoral fellow in the Harvard History Department and a lecturer in the History of Science Department.
A widespread famine that weakened the population over decades could help explain the Black Death’s particularly high mortality. Over four or five years after arriving in Europe in 1347, the pandemic surged through the continent in waves that killed millions.
The ice-core data is part of a unique program linking traditional historical research with scientific data-collecting techniques. The program, called the Initiative for the Science of the Human Past at Harvard (SoHP), is headed by Michael McCormick, the Francis Goelet Professor of Medieval History. SoHP’s ice-core project is being conducted in collaboration with the University of Maine’s Climate Change Institute and researchers at Heidelberg University. The project’s approach puts it at the juncture of environmental science, archaeology, and history. It is supported by the Arcadia Fund of London.
More presented his findings at a conference in November arranged to discuss the project. Joining him was Harvard junior Matthew Luongo, an Earth sciences and environmental engineering concentrator from Dunster House, who discussed the discovery of volcanic tephra in the ice core. Tephra, microscopic airborne volcanic particles, are generally believed absent from cores in European glaciers, make Luongo’s assumption-puncturing discovery potentially significant.
Luongo spent several days at the Climate Change Institute last summer performing chemical analyses and examining the volcanic bits through a scanning electron microscope. Each volcanic eruption has a slightly different chemical fingerprint, so he was able to trace the tephra to the 1875 Askja eruption in Iceland, one of the largest eruptions there in history.
Since many eruptions were written about contemporaneously, the ice core’s volcanic traces can be used to align ice-core data with written records, providing greater certainty in dating other chemical traces in the ice, such as those from human activities like lead from Roman-era smelting.
“I think it was a really important project,” Luongo said.
McCormick said that the advanced technologies scientists used to understand areas like the human genome and climate change are increasingly being applied to the humanities, and opening new avenues of investigation.
McCormick was part of a team that in 2011 used tree-ring data to reconstruct European climate over the last 2,500 years, showing that the period before the fall of the Roman Empire was marked by wide climactic variability. In November, McCormick summed up the use of climate data in historical research as reading history “from the environment itself.”
“All these things are happening in the sciences and spilling over into the humanities,” McCormick said. “Twenty years ago, if you’d have told me that climate could have caused the collapse of the Roman Empire and that we would have the means to test that, I wouldn’t have believed you.”
The new data emerging from the ice core could be the first of a flood of information about the last millennium and beyond. McCormick’s University of Maine colleagues, led by Paul Mayewski, have developed a laser-based method of ice analysis. It requires far smaller samples of ice and can take 50,000 samples in a one-meter ice core, compared with just 100 in the previous method. The new technology allows much higher resolution analysis of even very thin ice layers — to the specific year and potentially to individual storms — and can go back farther than the 1500 A.D. limit of this glacier with previous techniques.
The ice core was the first ever taken specifically for historical research, McCormick said, and was drilled in 2013 from the Colle Gnifetti glacier, high in the Alps near the Swiss-Italian border. It was divided between partner organizations, with the portion allocated to the Initiative for the Science of the Human Past and the Climate Change Institute being held at the University of Maine.
The findings about the period preceding the Black Death described by More continue to fill in an emerging and newly complex picture of a key period in human history. Recent research has traced the genesis of the European plague to animal groups in Asia and climate-related outbreaks that traveled along Silk Road trade routes.
McCormick said this application of scientific methods opens new avenues of inquiry, akin to discovering colossal collections of historical records, whether read directly from the DNA of ancient people, from the trees that grew at the time, or from the ice deposited in ancient storms.
“It’s a gigantic set of archives that document the least-documented part of [history],” McCormick said. “It’s kind of a renaissance of history.”
Author: Alvin Powell | Source: Harvard University [January 07, 2016]
For each ton of carbon dioxide (CO2) that any person on our planet emits, 3 m² of Arctic summer sea ice disappear. This is the finding of a new study that has been published in the journal Science this week by Dr. Dirk Notz, leader of Max Planck research group "Sea Ice in the Earth System" at the Max Planck Institute for Metorology (MPI-M) and by Prof. Julienne Stroeve from the National Snow and Ice Data Centre in Boulder, Colorado, and the University College London, UK. These numbers allow one for the first time to grasp the individual contribution to global climate change. The study also explains why climate models usually simulate a lower sensitivity - and concludes that the 2 °C global warming target will not allow Arctic summer sea ice to survive.
The rapid retreat of Arctic sea ice is one of the most direct indicators of the ongoing climate change on our planet. Over the past forty years, the ice cover in summer has shrunk by more than half, with climate model simulations predicting that the remaining half might be gone by mid century unless greenhouse gas emissions are reduced rapidly. However, a number of studies have indicated that climate models underestimate the loss of Arctic sea ice, which is why the models might not be the most suitable tools to quantify the future evolution of the ice cover.
To address this issue, a new study in the >journal Science now derives the future evolution of Arctic summer sea ice directly from the observational record. To do so, the authors examine the link between carbon-dioxide emissions and the area of Arctic summer sea ice, and find that both are linearly related. "The observed numbers are very simple", explains lead author Dirk Notz. "For each ton of carbon dioxide that a person emits anywhere on this planet, 3 m² of Arctic summer sea ice disappear." And his co-author Julienne Stroeve from adds: "So far, climate change has often felt like a rather abstract notion. Our results allow us to overcome this perception. For example, it is now straight-forward to calculate that the carbon dioxide emissions for each seat on a return flight from, say, London to San Francisco causes about 5 m² of Arctic sea ice to disappear."
The figure shows the linear relationship between cumulative CO2 emissions and Arctic sea-ice area in September. The sea-ice area is from 1953 to 1978 primarily based on ship and airplane measurements, since 1979 primarily on satellite measurements [Credit: Dirk Notz]
The study also explains the linear relationship between carbon-dioxide emissions and sea-ice loss. "Put simply, for each ton of carbon dioxide emission, the climate warms a little bit. To compensate for this warming, the sea-ice edge moves northward to a region with less incoming solar radiation. This then causes the sea-ice area to shrink. Simple geometric reasons cause these processes to combine to the observed linearity", explains Notz.
Climate models also simulate the observed linear relationship between sea-ice area and CO2 emissions. However, they usually have a much lower sensitivity of the ice cover than has been observed. The Science study finds that this is most likely because the models underestimate the atmospheric warming in the Arctic that is induced by a given carbon-dioxide emission. "It seems that it's not primarily the sea-ice models that are responsible for the mismatch. The ice just melts too slow in the models because their Arctic warming is too weak", says Stroeve.
Regarding the future evolution of Arctic sea ice, the new study finds that the internationally agreed 2 °C global warming target is not sufficient to allow Arctic summer sea ice to survive. Given the observed sensitivity of the ice cover, the sea ice is gone throughout September once another 1000 gigatons of carbon dioxide have been emitted. This amount of emissions is usually taken as a rough estimate of the allowable emissions to reach the 2 °C global-warming target. Only for the much lower emissions that would allow one to keep global warming below 1.5 °C, as called for by the Paris agreement, Arctic summer sea ice has a realistic chance of long-term survival, the study concludes.
Scientists working off west Africa in the Cape Verde Islands have found evidence that the sudden collapse of a volcano there tens of thousands of years ago generated an ocean tsunami that dwarfed anything ever seen by humans. The researchers say an 800-foot wave engulfed an island more than 30 miles away. The study could revive a simmering controversy over whether sudden giant collapses present a realistic hazard today around volcanic islands, or even along more distant continental coasts. The study appears today in the journal Science Advances.
Geologists think that the eastern slope of Fogo volcano crashed into the sea some 65,000 to 124,000 years ago, leaving a giant scar where a new volcano can be seen growing in this satellite image [Credit: NASA]
"Our point is that flank collapses can happen extremely fast and catastrophically, and therefore are capable of triggering giant tsunamis," said lead author Ricardo Ramalho, who did the research as a postdoctoral associate at Columbia University's Lamont-Doherty Earth Observatory, where he is now an adjunct scientist. "They probably don't happen very often. But we need to take this into account when we think about the hazard potential of these kinds of volcanic features."
The apparent collapse occurred some 73,000 years ago at the Fogo volcano, one of the world's largest and most active island volcanoes. Nowadays, it towers 2,829 meters (9,300 feet) above sea level, and erupts about every 20 years, most recently last fall. Santiago Island, where the wave apparently hit, is now home to some 250,000 people.
There is no dispute that volcanic flanks present a hazard; at least eight smaller collapses have occurred in Alaska, Japan and elsewhere in the last several hundred years, and some have generated deadly tsunamis. But many scientists doubt whether big volcanoes can collapse with the suddenness that the new study suggests. Rather, they envision landslides coming in gradual stages, generating multiple, smaller tsunamis. A 2011 French study also looked at the Fogo collapse, suggesting that it took place somewhere between 124,000-65,000 years ago; but that study says it involved more than one landslide. The French researchers estimate that the resulting multiple waves would have reached only 45 feet--even at that, enough to do plenty of harm today.
A handful of previous other studies have proposed much larger prehistoric collapses and resulting megatsunamis, in the Hawaiian islands, at Italy's Mt. Etna, and the Indian Ocean's Reunion Island. But critics have said these examples are too few and the evidence too thin. The new study adds a new possible example; it says the estimated 160 cubic kilometers (40 cubic miles) of rock that Fogo lost during the collapse was dropped all at once, resulting in the 800-foot wave. By comparison, the biggest known recent tsunamis, which devastated the Indian Ocean's coasts in 2004 and eastern Japan in 2011, reached only about 100 feet. (Like most other well documented tsunamis, these were generated by movements of undersea earthquake faults--not volcanic collapses.)
On a clear day, from these cliffs in northern Santiago island, it is possible to see a silhouette of Fogo, nearly 40 miles away. The geologists on this ridge believe that a tsunami generated by Fogo's sudden collapse generated a wave that swept the spot where they are standing [Credit: Kim Martineau/Lamont-Doherty Earth Observatory]
Santiago Island lies 55 kilometers (34 miles) from Fogo. Several years ago, Ramalho and colleagues were working on Santiago when they spotted unusual boulders lying as far as 2,000 feet inland and nearly 650 feet above sea level. Some are as big as delivery vans, and they are utterly unlike the young volcanic terrain on which they lie. Rather, they match marine-type rocks that ring the island's shoreline: limestones, conglomerates and submarine basalts. Some weigh up to 770 tons. The only realistic explanation the scientists could come up with: A gigantic wave must have ripped them from the shoreline and lofted them up. They derived the size of the wave by calculating the energy it would have taken to accomplish this feat.
To date the event, in the lab Ramalho and Lamont-Doherty geochemist Gisela Winckler measured isotopes of the element helium embedded near the boulders' surfaces. Such isotopes change depending on how long a rock has been lying in the open, exposed to cosmic rays. The analyses centered around 73,000 years--well within the earlier French estimate of a smaller event. The analysis "provides the link between the collapse and impact, which you can make only if you have both dates," said Winckler.
Tsunami expert Bill McGuire, a professor emeritus at University College London who was not involved in the research, said the study "provides robust evidence of megatsunami formation [and] confirms that when volcanoes collapse, they can do so extremely rapidly." Based on his own work, McGuire s says that such megatsunamis probably come only once every 10,000 years. "Nonetheless," he said, "the scale of such events, as the Fogo study testifies, and their potentially devastating impact, makes them a clear and serious hazard in ocean basins that host active volcanoes."
Ramalho cautions that the study should not be taken as a red flag that another big collapse is imminent here or elsewhere. "It doesn't mean every collapse happens catastrophically," he said. "But it's maybe not as rare as we thought."
The tsunami generated by Fogo's collapse apparently swept boulders like this one from the shoreline up into the highlands of Santiago island. Here, a researcher chisels out a sample [Credit: Ricardo Ramalho]
In the early 2000s, other researchers started publishing evidence that the Cape Verdes could generate large tsunamis. Others have argued that Spain's Canary Islands have already done so. Simon Day, a senior researcher at University College London has sparked repeated controversy by warning that any future eruption of the Canary Islands' active Cumbre Vieja volcano could set off a flank collapse that might form an initial wave 3,000 feet high. This, he says, could erase more than nearby islands. Such a wave might still be 300 feet high when it reached west Africa an hour or so later he says, and would still be 150 feet high along the coasts of North and South America. So far, such studies have raised mainly tsunamis of publicity, and vigorous objections from other scientists that such events are improbable. A 2013 study of deep-sea sediments by the United Kingdom's National Oceanography Centre suggests that the Canaries have probably mostly seen gradual collapses.
Part of the controversy hangs not only on the physics of the collapses themselves, but on how efficiently resulting waves could travel. In 1792, part of Japan's Mount Unzen collapsed, hitting a series of nearby bays with waves as high as 300 feet, and killing some 15,000 people. On July 9, 1958, an earthquake shook 90 million tons of rock into Alaska's isolated Lituya Bay; this created an astounding 1,724-foot-high wave, the largest ever recorded. Two fishermen who happened to be in their boat that day were carried clear over a nearby forest; miraculously, they survived.
These events, however, occurred in confined spaces. In the open ocean, waves created by landslides are generally thought to lose energy quickly, and thus to pose mainly a regional hazard. However, this is based largely on modeling, not real-world experience, so no one really knows how fast a killer wave might decay into a harmless ripple. In any case, most scientists are more concerned with tsunamis generated by undersea earthquakes, which are more common. When seabed faults slip, as they did in 2004 and 2011, they shove massive amounts of water upward. In deep water, this shows up as a mere swell at the surface; but when the swell reaches shallower coastal areas, its energy concentrates into in a smaller volume of water, and it rears up dramatically. The 2004 Indian Ocean earthquake and tsunami killed 230,000 people in 14 countries; the 2011 Tohoku event killed nearly 20,000 in Japan, and has caused a long-term nuclear disaster.
James Hunt, a tsunami expert at the United Kingdom's National Oceanography Centre who was not involved in the study, said the research makes it clear that "even modest landslides could produce high-amplitude anomalous tsunami waves on opposing island coastlines." The question, he said, "is whether these translate into hazardous events in the far field, which is debatable."
When Fogo erupted last year, Ramalho and other geologists rushed in to observe. Lava flows (since calmed down) displaced some 1,200 people, and destroyed buildings including a new volcano visitors' center. "Right now, people in Cape Verde have a lot more to worry about, like rebuilding their livelihoods after the last eruption," said Ramalho. "But Fogo may collapse again one day, so we need to be vigilant."
Source: The Earth Institute at Columbia University [October 02, 2015]
While searching through historical archives to find out more about the 15th-century climate of what is now Belgium, northern France, Luxembourg, and the Netherlands, Chantal Camenisch noticed something odd. "I realised that there was something extraordinary going on regarding the climate during the 1430s," says the historian from the University of Bern in Switzerland.
One of the historical documents analysed by the team was a Bernese chronicle which contains the record 'Von einem grossen Sterbot zu Bernn' 1439 (About a great mortality in Bern 1439), Diebold Schilling, Amtliche Berner Chronik (1478-1483), vol. 2, Bern, Burgerbibliothek, Mss.h.h.I.2, p. 6 [Credit: Bern Burgerbibliothek, www.e-codices.unifr.ch]
Compared with other decades of the last millennium, many of the 1430s' winters and some springs were extremely cold in the Low Countries, as well as in other parts of Europe. In the winter of 1432-33, people in Scotland had to use fire to melt wine in bottles before drinking it. In central Europe, many rivers and lakes froze over. In the usually mild regions of southern France, northern and central Italy, some winters lasted until April, often with late frosts. This affected food production and food prices in many parts of Europe. "For the people, it meant that they were suffering from hunger, they were sick and many of them died," says Camenisch.
She joined forces with Kathrin Keller, a climate modeller at the Oeschger Centre for Climate Change Research in Bern, and other researchers, to find out more about the 1430s climate and how it impacted societies in northwestern and central Europe. Their results are published in >Climate of the Past, a journal of the European Geosciences Union.
Historical documents describing the impacts of the 1430s extraordinary climate [Credit: Zurich, Staatsarchiv]
They looked into climate archives, data such as tree rings, ice cores, lake sediments and historical documents, to reconstruct the climate of the time. "The reconstructions show that the climatic conditions during the 1430s were very special. With its very cold winters and normal to warm summers, this decade is a one of a kind in the 400 years of data we were investigating, from 1300 to 1700 CE," says Keller. "What cannot be answered by the reconstructions alone, however, is its origin -- was the anomalous climate forced by external influences, such as volcanism or changes in solar activity, or was it simply the random result of natural variability inherent to the climate system?"
There have been other cold periods in Europe's history. In 1815, the volcano Mount Tambora spewed large quantities of ash and particles into the atmosphere, blocking enough sunlight to significantly reduce temperatures in Europe and other parts of the world. But the 1430s were different, not only in what caused the cooling but also because they hadn't been studied in detail until now.
Lake sediments from lake Oeschinen, Switzerland [Credit: Benjamin Amann, University of Bern]
The climate simulations ran by Keller and her team showed that, while there were some volcanic eruptions and changes in solar activity around that time, these could not explain the climate pattern of the 1430s. The climate models showed instead that these conditions were due to natural variations in the climate system, a combination of natural factors that occurred by chance and meant Europe had very cold winters and normal to warm summers.
Regardless of the underlying causes of the odd climate, the 1430s were "a cruel period" for those who lived through those years, says Camenisch. "Due to this cluster of extremely cold winters with low temperatures lasting until April and May, the growing grain was damaged, as well as the vineyards and other agricultural production. Therefore, there were considerable harvest failures in many places in northwestern and central Europe. These harvest failures led to rising food prices and consequently subsistence crisis and famine.
Microscopic view of laminated sediments from Lake Oeschinen, Switzerland [Credit: Benjamin Amann, University of Bern]Microscopic view of laminated sediments from Lake Zabinskje in Poland [Credit: Christoph Butz, University of Bern]
Furthermore, epidemic diseases raged in many places. Famine and epidemics led to an increase of the mortality rate." In the paper, the authors also mention other impacts: "In the context of the crisis, minorities were blamed for harsh climatic conditions, rising food prices, famine and plague." However, in some cities, such as Basel, Strasbourg, Cologne or London, societies adapted more constructively to the crisis by building communal granaries that made them more resilient to future food shortages.
Keller says another decade of very cold winters could happen again. "However, such temperature variations have to be seen in the context of the state of the climate system. Compared to the 15th century we live in a distinctly warmer world. As a consequence, we are affected by climate extremes in a different way -- cold extremes are less cold, hot extremes are even hotter."
Finding clues to Earth's past climate in stalagmites [Credit: Adam Hasenfratz]
The team says their Climate of the Past study could help people today by showing how societies can be affected by extreme climate conditions, and how they should take precautions to make themselves less vulnerable to them. In the 1430s, people had not been exposed to such extreme conditions before and were unprepared to deal with the consequences.
"Our example of a climate-induced challenge to society shows the need to prepare for extreme climate conditions that might be coming sooner or later," says Camenisch. "It also shows that, to avoid similar or even larger crises to that of the 1430s, societies today need to take measures to avoid dangerous anthropogenic climate interference."
Source: European Geosciences Union [December 01, 2016]
Analysis of the first fossil bee nest from the Plio-Pleistocene of South Africa suggests that the human ancestor Australopithecus africanus lived in a dry savannah environment, according a study published in the >open-access journal PLOS ONE by Jennifer Parker from University College London, United Kingdom, and colleagues.
Photographs of each of the Individual Pieces of Extracted Nest [CreditJennifer F. Parker et al./PLOS ONE (2016)]
Little paleoecological information is available for the site in South Africa where the first Au. africanus fossil—the 'Taung Child'—was discovered. However, insect-related fossils, abundant at the discovery site, can yield insights into the paleoenvironment. Bees, for example, tend to build characteristic nests in characteristic conditions. Parker and colleagues analyzed CT scans of a fossil bee nest that was discovered near the Taung Child site to determine its internal structure and thus the kinds of bees that built it.
Locality and stratigraphy of the deposits [Credit: Jennifer F. Parker et al./PLOS ONE (2016)]
The fossil nest was exceptionally well preserved, and the structure of its cells and tunnels suggested that it was made by a ground-nesting solitary bee. These bees typically nest on bare, light, dry soil that is exposed to the sun, which bolsters other recent evidence that Au. africanus lived in dry savannahs. Insect-related fossils are common but largely overlooked at sites where human ancestors lived, the researchers said, and their work underscores the contribution such fossils can make to understanding the environments where human ancestors lived.
Three different individual cells. (A) and (B) have been extracted from the nest, and (C) (although broken in half laterally) remains in the matrix [Credit: Jennifer F. Parker et al./PLOS ONE (2016)]
"When Raymond Dart published his description of the 'Taung Child' in 1925 he profoundly changed our understanding of human evolution," says study co-author Philip Hopley. "In the 90 years following his discovery, attention of anthropologists has moved to other African sites and specimens, and research at Taung has been hampered by the complex geology and uncertain dating. New research at Taung is helping to reconstruct the environment in which this enigmatic little hominin lived and died."
Source: Public Library of Science [September 29, 2016]
Researchers from Royal Holloway, Birkbeck and Kings College, University of London used satellite images to map abandoned shore lines around Palaeolake Mega-Chad, and analysed sediments to calculate the age of these shore lines, producing a lake level history spanning the last 15,000 years.
Fossilized fish: The drying of Lake Mega-Chad reveals a story of dramatic climate change in the southern Sahara, with a rapid change from a giant lake to desert dunes and dust, due to changes in rainfall from the West African Monsoon [Credit: University of Royal Holloway London]
At its peak around 6,000 years ago, Palaeolake Mega-Chad was the largest freshwater lake on Earth, with an area of 360,000 km2. Now today's Lake Chad is reduced to a fraction of that size, at only 355 km2. The drying of Lake Mega-Chad reveals a story of dramatic climate change in the southern Sahara, with a rapid change from a giant lake to desert dunes and dust, due to changes in rainfall from the West African Monsoon. The research, published in the journal Proceedings of the National Academy of Sciences confirms earlier suggestions that the climate change was abrupt, with the southern Sahara drying in just a few hundred years.
Part of the Palaeolake Mega-Chad basin that has dried completely is the Bodele depression, which lies in remote northern Chad. The Bodele depression is the World's single greatest source of atmospheric dust, with dust being blown across the Atlantic to South America, where it is believed to be helping to maintain the fertility of tropical rainforests. However, the University of London team's research shows that a small lake persisted in the Bodele depression until about 1,000 years ago. This lake covered the parts of the Bodele depression which currently produce most dust, limiting the dust potential until recent times.
"The Amazon tropical forest is like a giant hanging basket," explains Dr Simon Armitage from the Department of Geography at Royal Holloway. "In a hanging basket, daily watering quickly washes soluble nutrients out of the soil, and these need to be replaced using fertiliser if the plants are to survive. Similarly, heavy washout of soluble minerals from the Amazon basin means that an external source of nutrients must be maintaining soil fertility. As the World's most vigorous dust source, the Bodele depression has often been cited as a likely source of these nutrients, but our findings indicate that this can only be true for the last 1,000 years," he added.
Source: University of Royal Holloway London [June 29, 2015]
Trekking across the high Canadian Arctic almost 20 years ago, Howie Scher had an unexpected encounter that helped fix the course of his career.
The Antarctic Circumpolar Current blocks the Southern Hemisphere equivalent of the Gulf Stream from delivering heat to Antarctica, Scher says [Credit: adapted from Nature]
An undergraduate on a research expedition over summer break, Scher was part of a scientific group traveling deep into the Arctic Circle to collect basalt cores for paleomagnetic analysis. But as focused as the team was on finding rocks with magnetic minerals that can help establish where on Earth they had formed, it was stony deposits that had once been very much alive that really caught the team's collective eye.
"We stumbled across a fossil bone bed there," Scher says. "We were pulling out vertebrate fossils--crocodilians, turtles, bony fish--and when we got home we showed them to a paleontologist who told us it was a warm water assemblage. That was a great experience as a freshman in college, and it got me very interested in climate--just seeing how it had been so different in the past than what my experience was near the North Pole, trudging through the snow."
Now an associate professor at the University of South Carolina, Scher has made a career of climate science. He is part of an international team that recently published a report pinpointing the genesis of one of the cornerstones of the Earth's current climate system, the Antarctic Circumpolar Current.
A constant eastward flow of ocean water in the Southern Ocean encircling Antarctica, the Antarctic Circumpolar Current is akin to the Gulf Stream, the current that moves water through the Atlantic Ocean from the tip of Florida, along the east coast of North America, and, by extension into the North Atlantic Current, to the shores of western and northern Europe. The Gulf Stream's transport of warm southern waters northward is why many European countries have more temperate climates than would be expected purely from their latitudes (relatively mild London, for example, lies more than 500 miles further north than Toronto).
But if the Atlantic Circumpolar Current is something like the Gulf Stream, there's a notable difference: it's even bigger.
"It's the largest ocean current today, and it's the only one that connects all the ocean basins," Scher says. "The Atlantic, Pacific and the Indian are huge oceans, but they're all bounded by continents; they have firm boundaries. The Southern Ocean, around Antarctica, is the only band of latitude where there's an ocean that goes continuously around the globe. Because of that, the winds that blow over the Southern Ocean are unimpeded by continental barriers.
"So the distance that the wind can blow over the ocean, which as oceanographers we call the 'fetch,' is infinite. And fetch is one of the things that determines how high the waves are, how much mixing goes on in the oceans, and ultimately what drives surface ocean currents. With infinite fetch, you can have a very strong ocean current, and because this particular band of ocean connects all of the world's oceans, it transports heat and salt and nutrients all around the world."
The boundary between the easterly and westerly prevailing winds (the polar front) during the Oligocene epoch (yellow line) was determined from fossil data [Credit: adapted from Nature]
In a paper recently published in the journal Nature, Scher and his team make the case for just when this massive ocean current first started flowing. One straightforward obstacle in the distant past was the arrangement of continental masses. Antarctica and Australia were part of a single super-continent, Gondwana, and began to separate about 83 million years ago, so the Pacific and Indian Oceans couldn't have been in contact near the South Pole before then.
It was much later than the initial separation of Australia and Antarctica that deep ocean currents could flow between the two continents, though. Paleoceanographers have identified a transition, the opening of the Tasmanian gateway, a deep-water channel between Tasmania and Antarctica, as being a necessary part of any large-scale, sustained flow on the order of the Antarctic Circumpolar Current.
Using novel information about the separation of Antarctica and Australia, Scher and his team developed a tectonic model that showed that the Tasmanian gateway first developed at least 500 meters of depth some time between 35 and 32 million years ago.
From geochemical analyses of sediment core, however, they concluded that the channel opening to that depth wasn't enough to get the Antarctic Circumpolar Current flowing. The Pacific Ocean is in contact with much younger rock than the Indian Ocean, Scher says, which leads to a distinguishing concentration in each ocean of one isotope of neodymium that has a half-life longer than that of the solar system.
By measuring neodymium isotope compositions incorporated into fish teeth fossils in core samples, the team was able to establish that eastward current flow between the Pacific and Indian Oceans didn't begin until about 30 million years ago, some 2 to 5 million years after the Tasmanian gateway opened.
Taking both geophysical and geochemical data into account, they conclude that although the Tasmanian gateway was wide enough to accommodate a deep current, the gateway was located too far south to be in contact with the mid-latitude trade winds, which are the driving force for today's eastward-flowing Antarctic Circumpolar Current.
Instead, when the gateway first opened, water initially flowed westward, the opposite of that today, in keeping with the prevailing polar winds located at the more southern latitudes.
Only as both continents, and the gateway between the two, drifted northward on their tectonic plates over the next several million years did alignment with the trade winds come about. That reversed the current flow, to the east, and the Antarctic Circumpolar Current was born.
"It's the global mix-master of the oceans--that's a quote from Wally Broecker [of Columbia University's Lamont-Doherty Earth Observatory], and that's what it's been called by oceanographers for 50 years now," Scher says. "The Antarctic Circumpolar Current is the world's largest current today, it influences heat exchange and carbon exchange, and we really didn't know for how long it's been operating, which I call a major gap in our command of Earth history. It was a cool outcome."
Author: Steven Powell | Source: University of South Carolina [August 25, 2015]