The Great London [Search results for bridge]
New Thames Boulevard

At the Heart of Popular Culture

The London Architecture

Greenland: Huge ancient river basin explains location of the world's fastest flowing glacier

Space Exploration: Venus Express' swansong experiment sheds light on Venus' polar atmosphere

Genetics: Genes for nose shape found

Breaking News: Natural selection, key to evolution, also can impede formation of new species

The 1st Cable Car in London

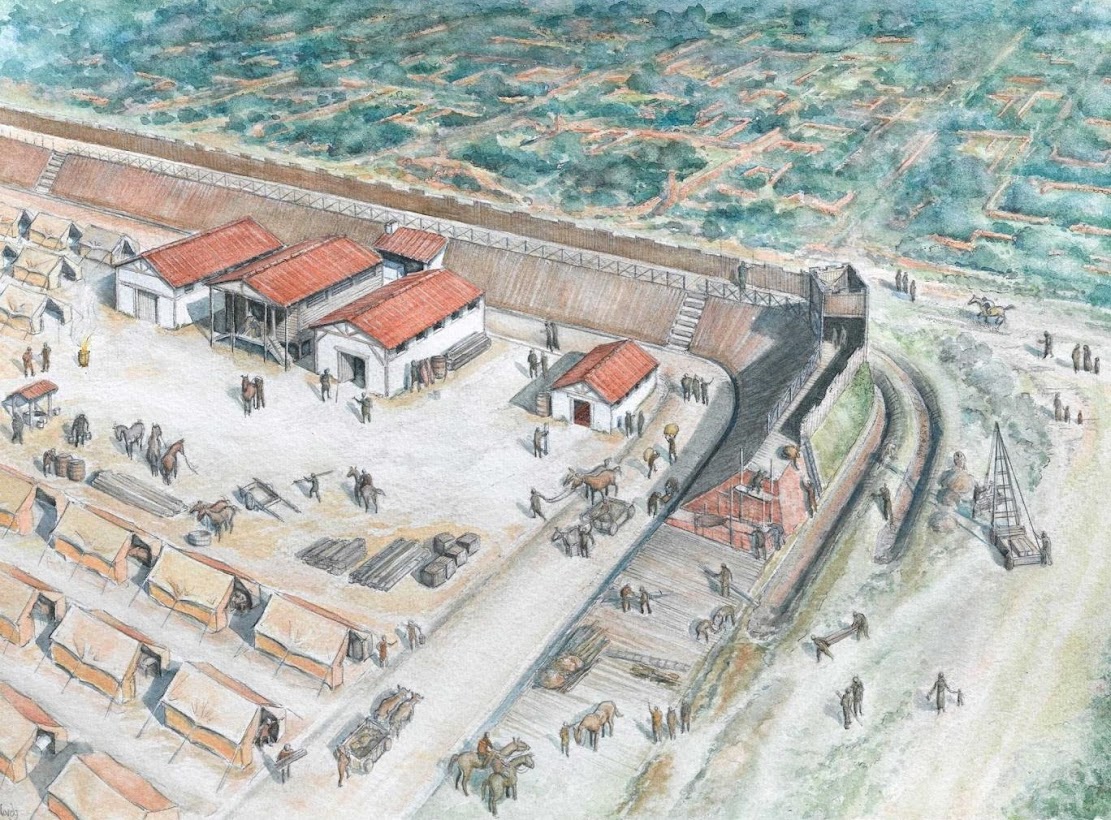
UK: Roman fort built in response to Boudicca’s revolt discovered in London
North America: Site with clues to fate of fabled Lost Colony may be saved

Evolution: Life as we know it most likely arose via 'long, slow dance'

Environment: New Ice Age to begin by 2030?
